skspatial.objects.Vector.plot_3d
- Vector.plot_3d(ax_3d, point: Union[ndarray, Sequence] = (0, 0, 0), scalar: float = 1, **kwargs) None[source]
Plot a 3D vector.
The vector is plotted by connecting two 3D points (the head and tail of the vector).
- Parameters:
Examples
>>> import matplotlib.pyplot as plt
>>> from mpl_toolkits.mplot3d import Axes3D
>>> from skspatial.objects import Vector
>>> fig = plt.figure()
>>> ax = fig.add_subplot(111, projection='3d')
>>> Vector([-1, 1, 1]).plot_3d(ax, point=(1, 2, 3), c='r')
(
Source code,png,hires.png,pdf)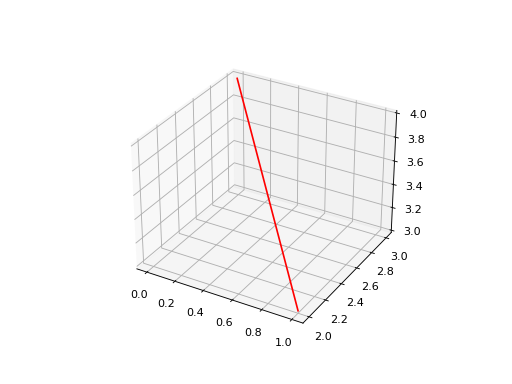