Plotting
This library uses matplotlib to enable plotting of all of its spatial objects. Each object has a plot_2d and/or plot_3d method. For example, a Point object can be plotted in 2D or 3D, while a Sphere object can only be plotted in 3D.
The matplotlib dependency is optional. To install it, you can install scikit-spatial with the extra plotting.
$ pip install 'scikit-spatial[plotting]'
The plot_2d methods require an instance of Axes as the first argument, while the plot_3d methods require an instance of Axes3D. This allows for placing multiple spatial objects on the same plot, which is useful for visualizing computations such as projection or intersection.
The methods also pass keyword arguments to matplotlib functions. For example, Point.plot_2d uses scatter() under the hood, so any keyword arguments to scatter() can also be input to the method. Some plotting methods have additional keyword arguments that are not passed to matplotlib, such as Line.plot_2d, which takes parameters t_1 and t_2 to determine the start and end points of the line.
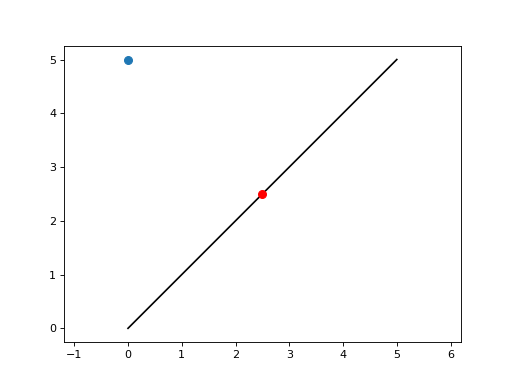
Let’s project a 2D point onto a 2D line and plot the result with plot_2d methods.
>>> import matplotlib.pyplot as plt
>>> from skspatial.objects import Point, Line
>>> point = Point([0, 5])
>>> line = Line(point=[0, 0], direction=[1, 1])
>>> point_projected = line.project_point(point)
>>> _, ax = plt.subplots()
>>> line.plot_2d(ax, t_2=5, c='k')
>>> point.plot_2d(ax, s=50)
>>> point_projected.plot_2d(ax, c='r', s=50, zorder=3)
>>> limits = ax.axis('equal')
(Source code, png, hires.png, pdf)

For convenience, the skspatial.plotting module contains plot_2d and plot_3d functions as well. These functions can place an arbitrary number of spatial objects on the same plot so that matplotlib doesn’t need to be imported directly. All spatial objects have a plotter method which is simply used to bundle keyword arguments for the plot_2d or plot_3d methods.
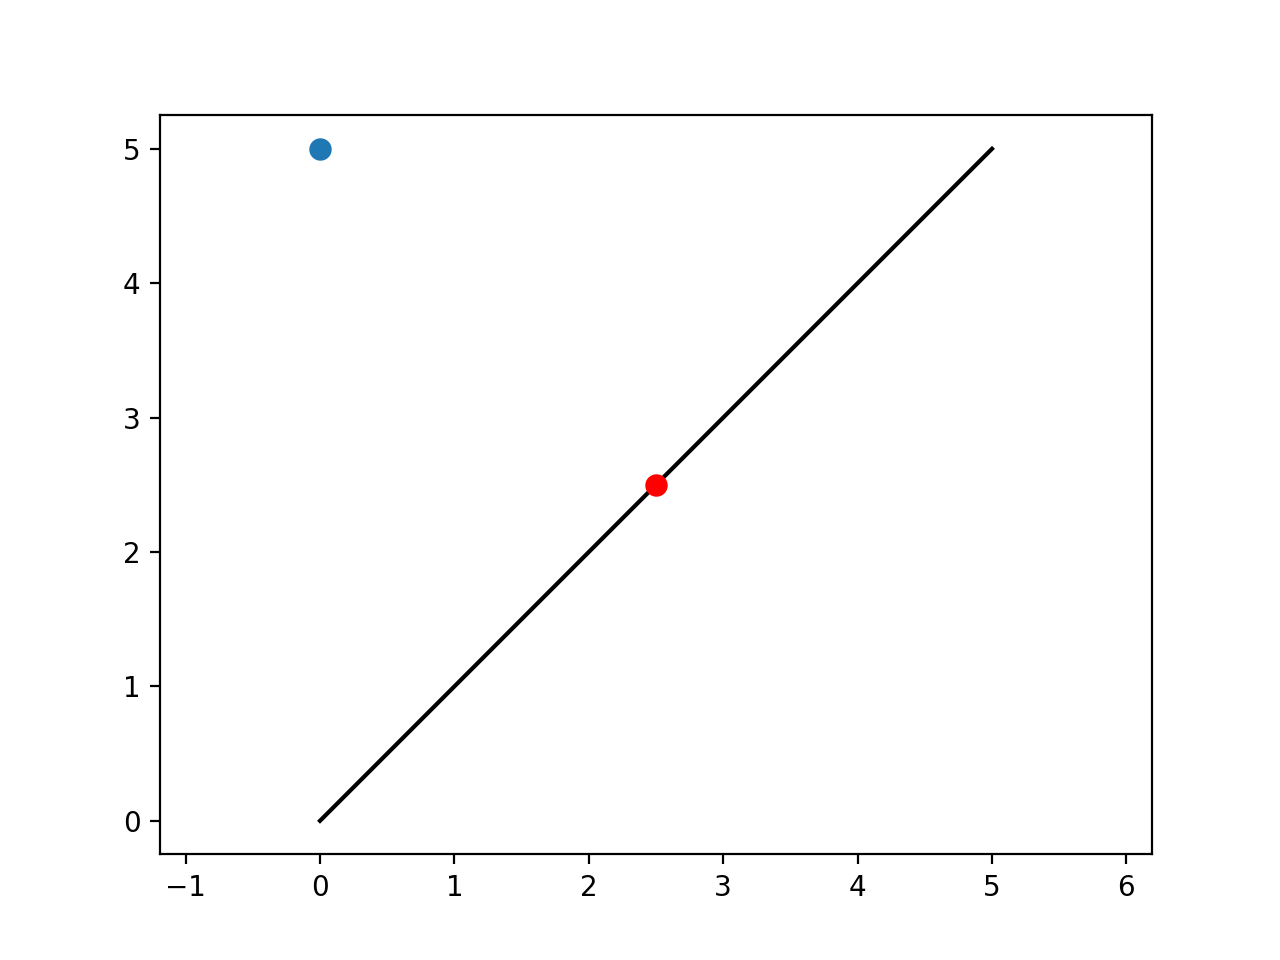
Let’s make the same plot as before with the plot_2d function. The function returns the standard matplotlib figure and axes objects so the plot can be easily customized.
>>> from skspatial.objects import Point, Line
>>> from skspatial.plotting import plot_2d
>>> point = Point([0, 5])
>>> line = Line(point=[0, 0], direction=[1, 1])
>>> point_projected = line.project_point(point)
>>> _, ax = plot_2d(
...   point.plotter(s=50),
...   point_projected.plotter(c='r', s=50, zorder=3),
...   line.plotter(t_2=5, c='k'),
... )
>>> limits = ax.axis('equal')
(Source code, png, hires.png, pdf)
