skspatial.objects.Line.plot_2d
- Line.plot_2d(ax_2d, t_1: float = 0, t_2: float = 1, **kwargs) None[source]
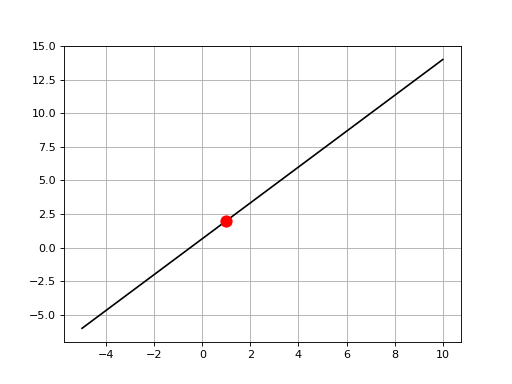
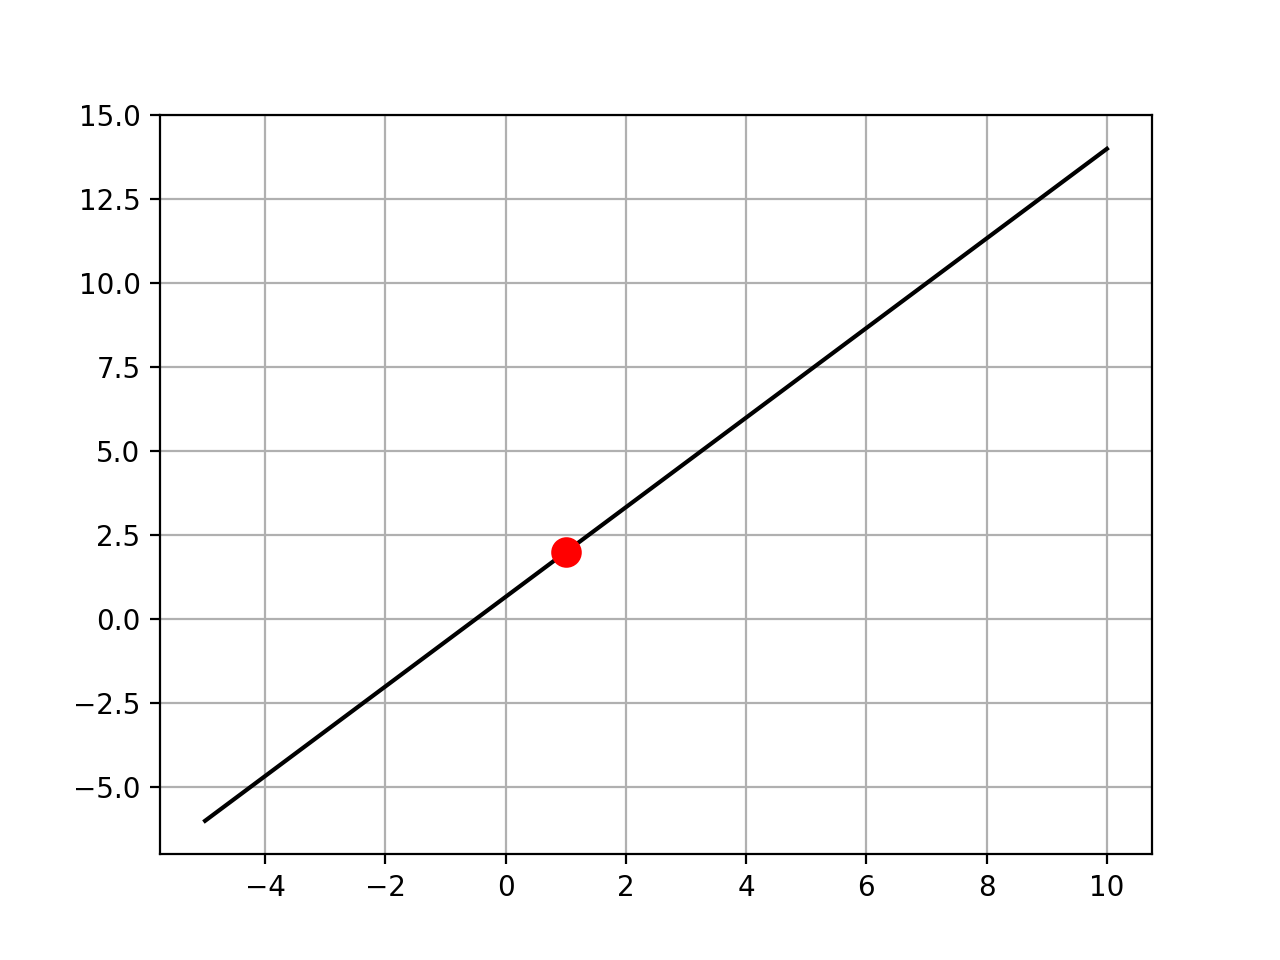
Plot a 2D line.
The line is plotted by connecting two 2D points.
- Parameters:
- ax_2dAxes
Instance of
Axes.- t_1, t_2{int, float}
Parameters to determine points 1 and 2 along the line. These are passed to
Line.to_point(). Defaults are 0 and 1.- kwargsdict, optional
Additional keywords passed to
plot().
Examples
>>> import matplotlib.pyplot as plt
>>> from skspatial.objects import Line
>>> _, ax = plt.subplots()
>>> line = Line([1, 2], [3, 4])
>>> line.plot_2d(ax, t_1=-2, t_2=3, c='k')
>>> line.point.plot_2d(ax, c='r', s=100, zorder=3)
>>> grid = ax.grid()
(
Source code,png,hires.png,pdf)