skspatial.objects.Points.plot_2d
- Points.plot_2d(ax_2d, **kwargs) None[source]
Plot the points on a 2D scatter plot.
Examples
>>> import matplotlib.pyplot as plt
>>> from skspatial.objects import Points
>>> fig, ax = plt.subplots()
>>> points = Points([[1, 2], [3, 4], [-4, 2], [-2, 3]])
>>> points.plot_2d(ax, c='k')
(
Source code,png,hires.png,pdf)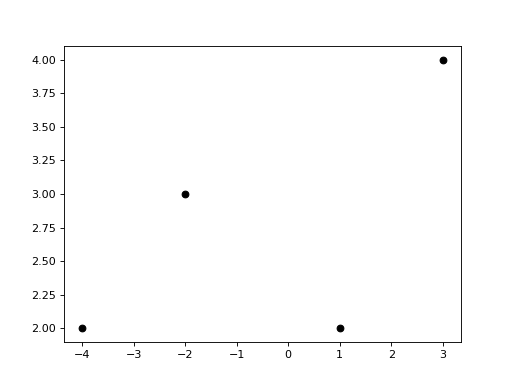