skspatial.objects.LineSegment.plot_2d
- LineSegment.plot_2d(ax_2d, **kwargs) None[source]
Plot a 2D line segment.
The line segment is plotted by connecting two 2D points.
Examples
>>> import matplotlib.pyplot as plt
>>> from skspatial.objects import LineSegment
>>> _, ax = plt.subplots()
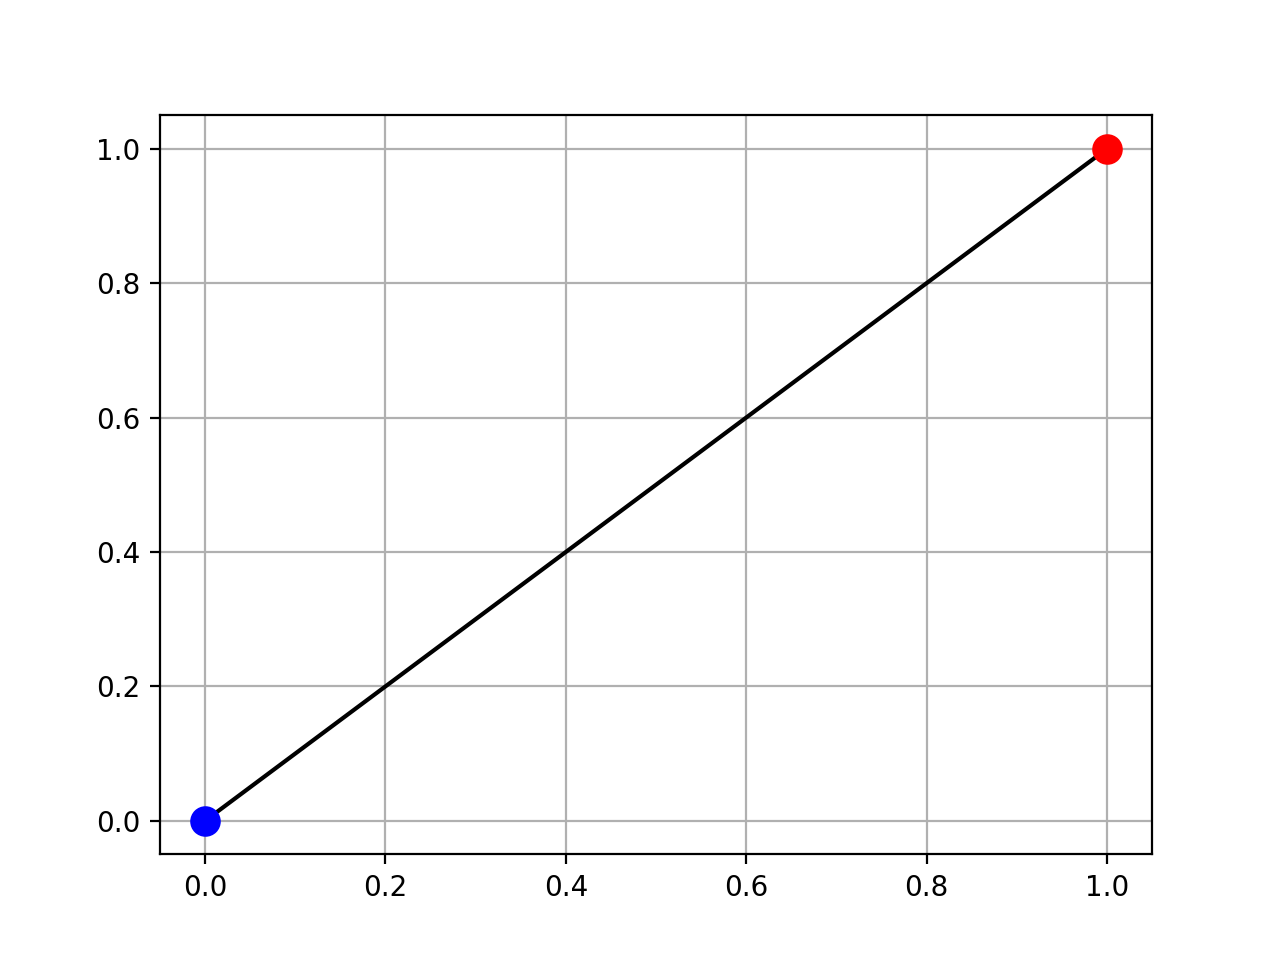
>>> segment = LineSegment([0, 0], [1, 1])
>>> segment.plot_2d(ax, c='k')
>>> segment.point_a.plot_2d(ax, c='b', s=100, zorder=3)
>>> segment.point_b.plot_2d(ax, c='r', s=100, zorder=3)
>>> grid = ax.grid()
(
Source code,png,hires.png,pdf)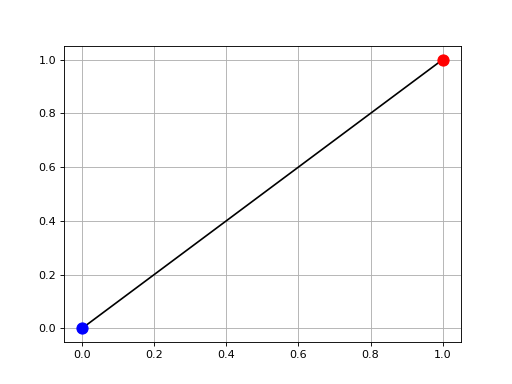