skspatial.objects.Vector.plot_2d
- Vector.plot_2d(ax_2d, point: Union[ndarray, Sequence] = (0, 0), scalar: float = 1, **kwargs) None[source]
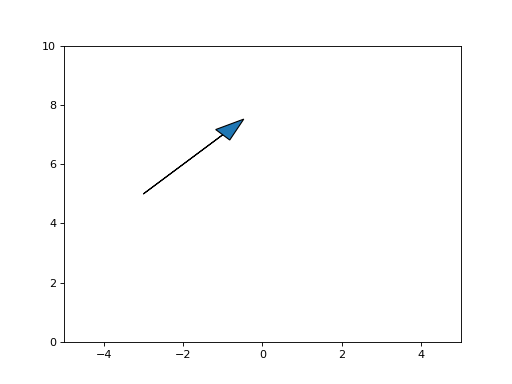
Plot a 2D vector.
The vector is plotted as an arrow.
- Parameters:
Examples
>>> import matplotlib.pyplot as plt
>>> from skspatial.objects import Vector
>>> _, ax = plt.subplots()
>>> Vector([1, 1]).plot_2d(ax, point=(-3, 5), scalar=2, head_width=0.5)
>>> limits = ax.axis([-5, 5, 0, 10])
(
Source code,png,hires.png,pdf)