skspatial.objects.Point.plot_3d
- Point.plot_3d(ax_3d, **kwargs) None[source]
Plot the point on a 3D scatter plot.
- Parameters:
Examples
>>> import matplotlib.pyplot as plt
>>> from mpl_toolkits.mplot3d import Axes3D
>>> from skspatial.objects import Point
>>> fig = plt.figure()
>>> ax = fig.add_subplot(111, projection='3d')
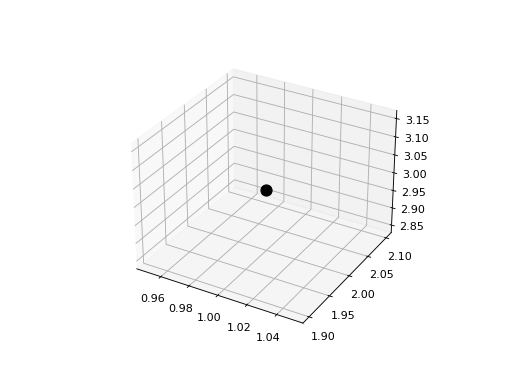
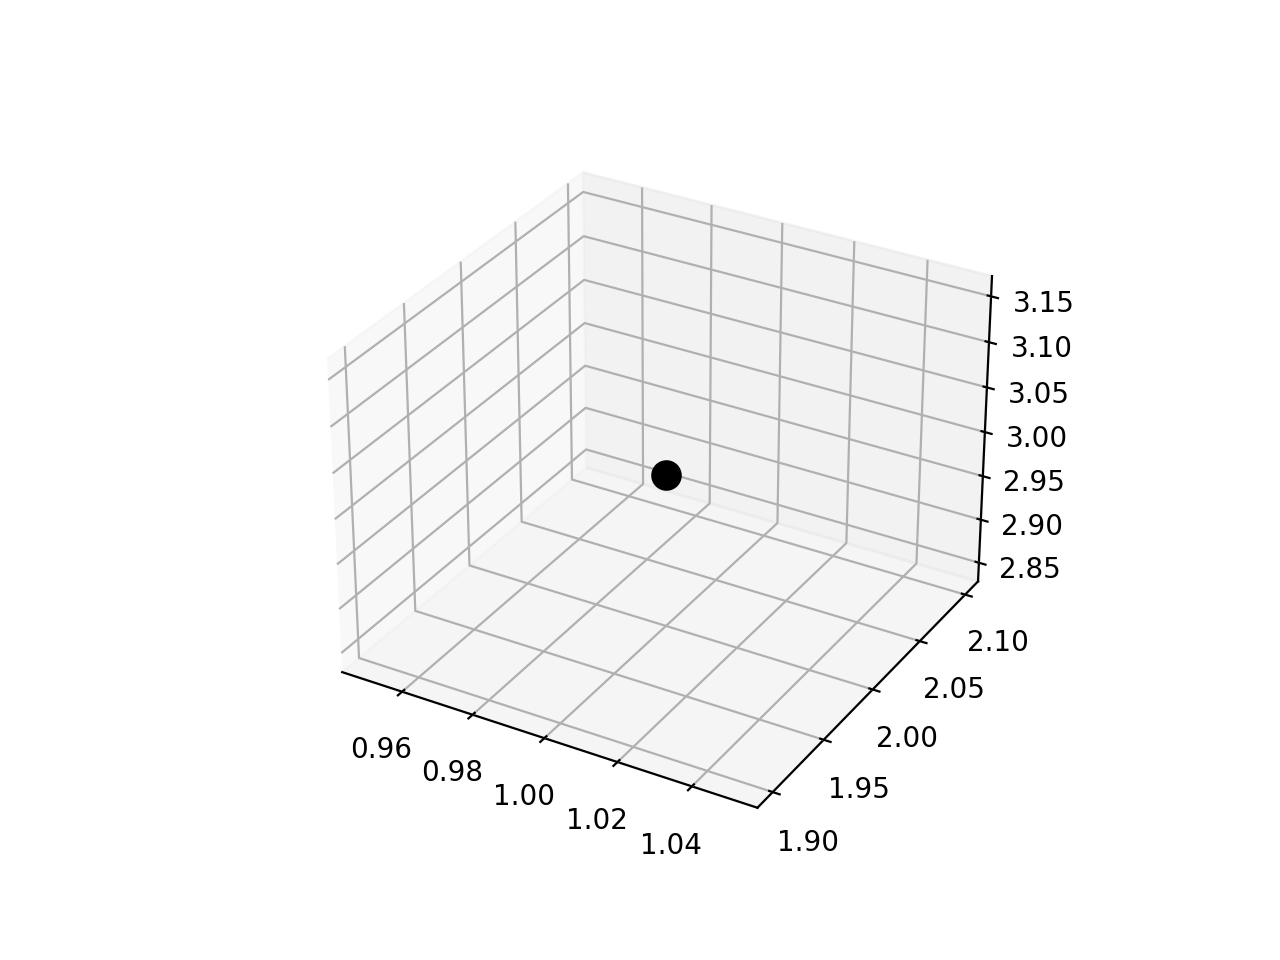
>>> Point([1, 2, 3]).plot_3d(ax, c='k', s=100)
(
Source code,png,hires.png,pdf)